The lack of catch-up growth in low income countries is a persistent puzzle in the field of development economics. According to basic theory, low income countries should grow more quickly because they have better opportunities for capital investments and technology transfer. There are a number of reasons the real world can diverge from basic theory (e.g. bad institutions, poor provision of public goods, frictions in technology transfer), but I recently came across a blogpost that suggests that this isn’t really a puzzle anymore. Low and middle income economies do seem to be growing more quickly relative to the advanced economies:
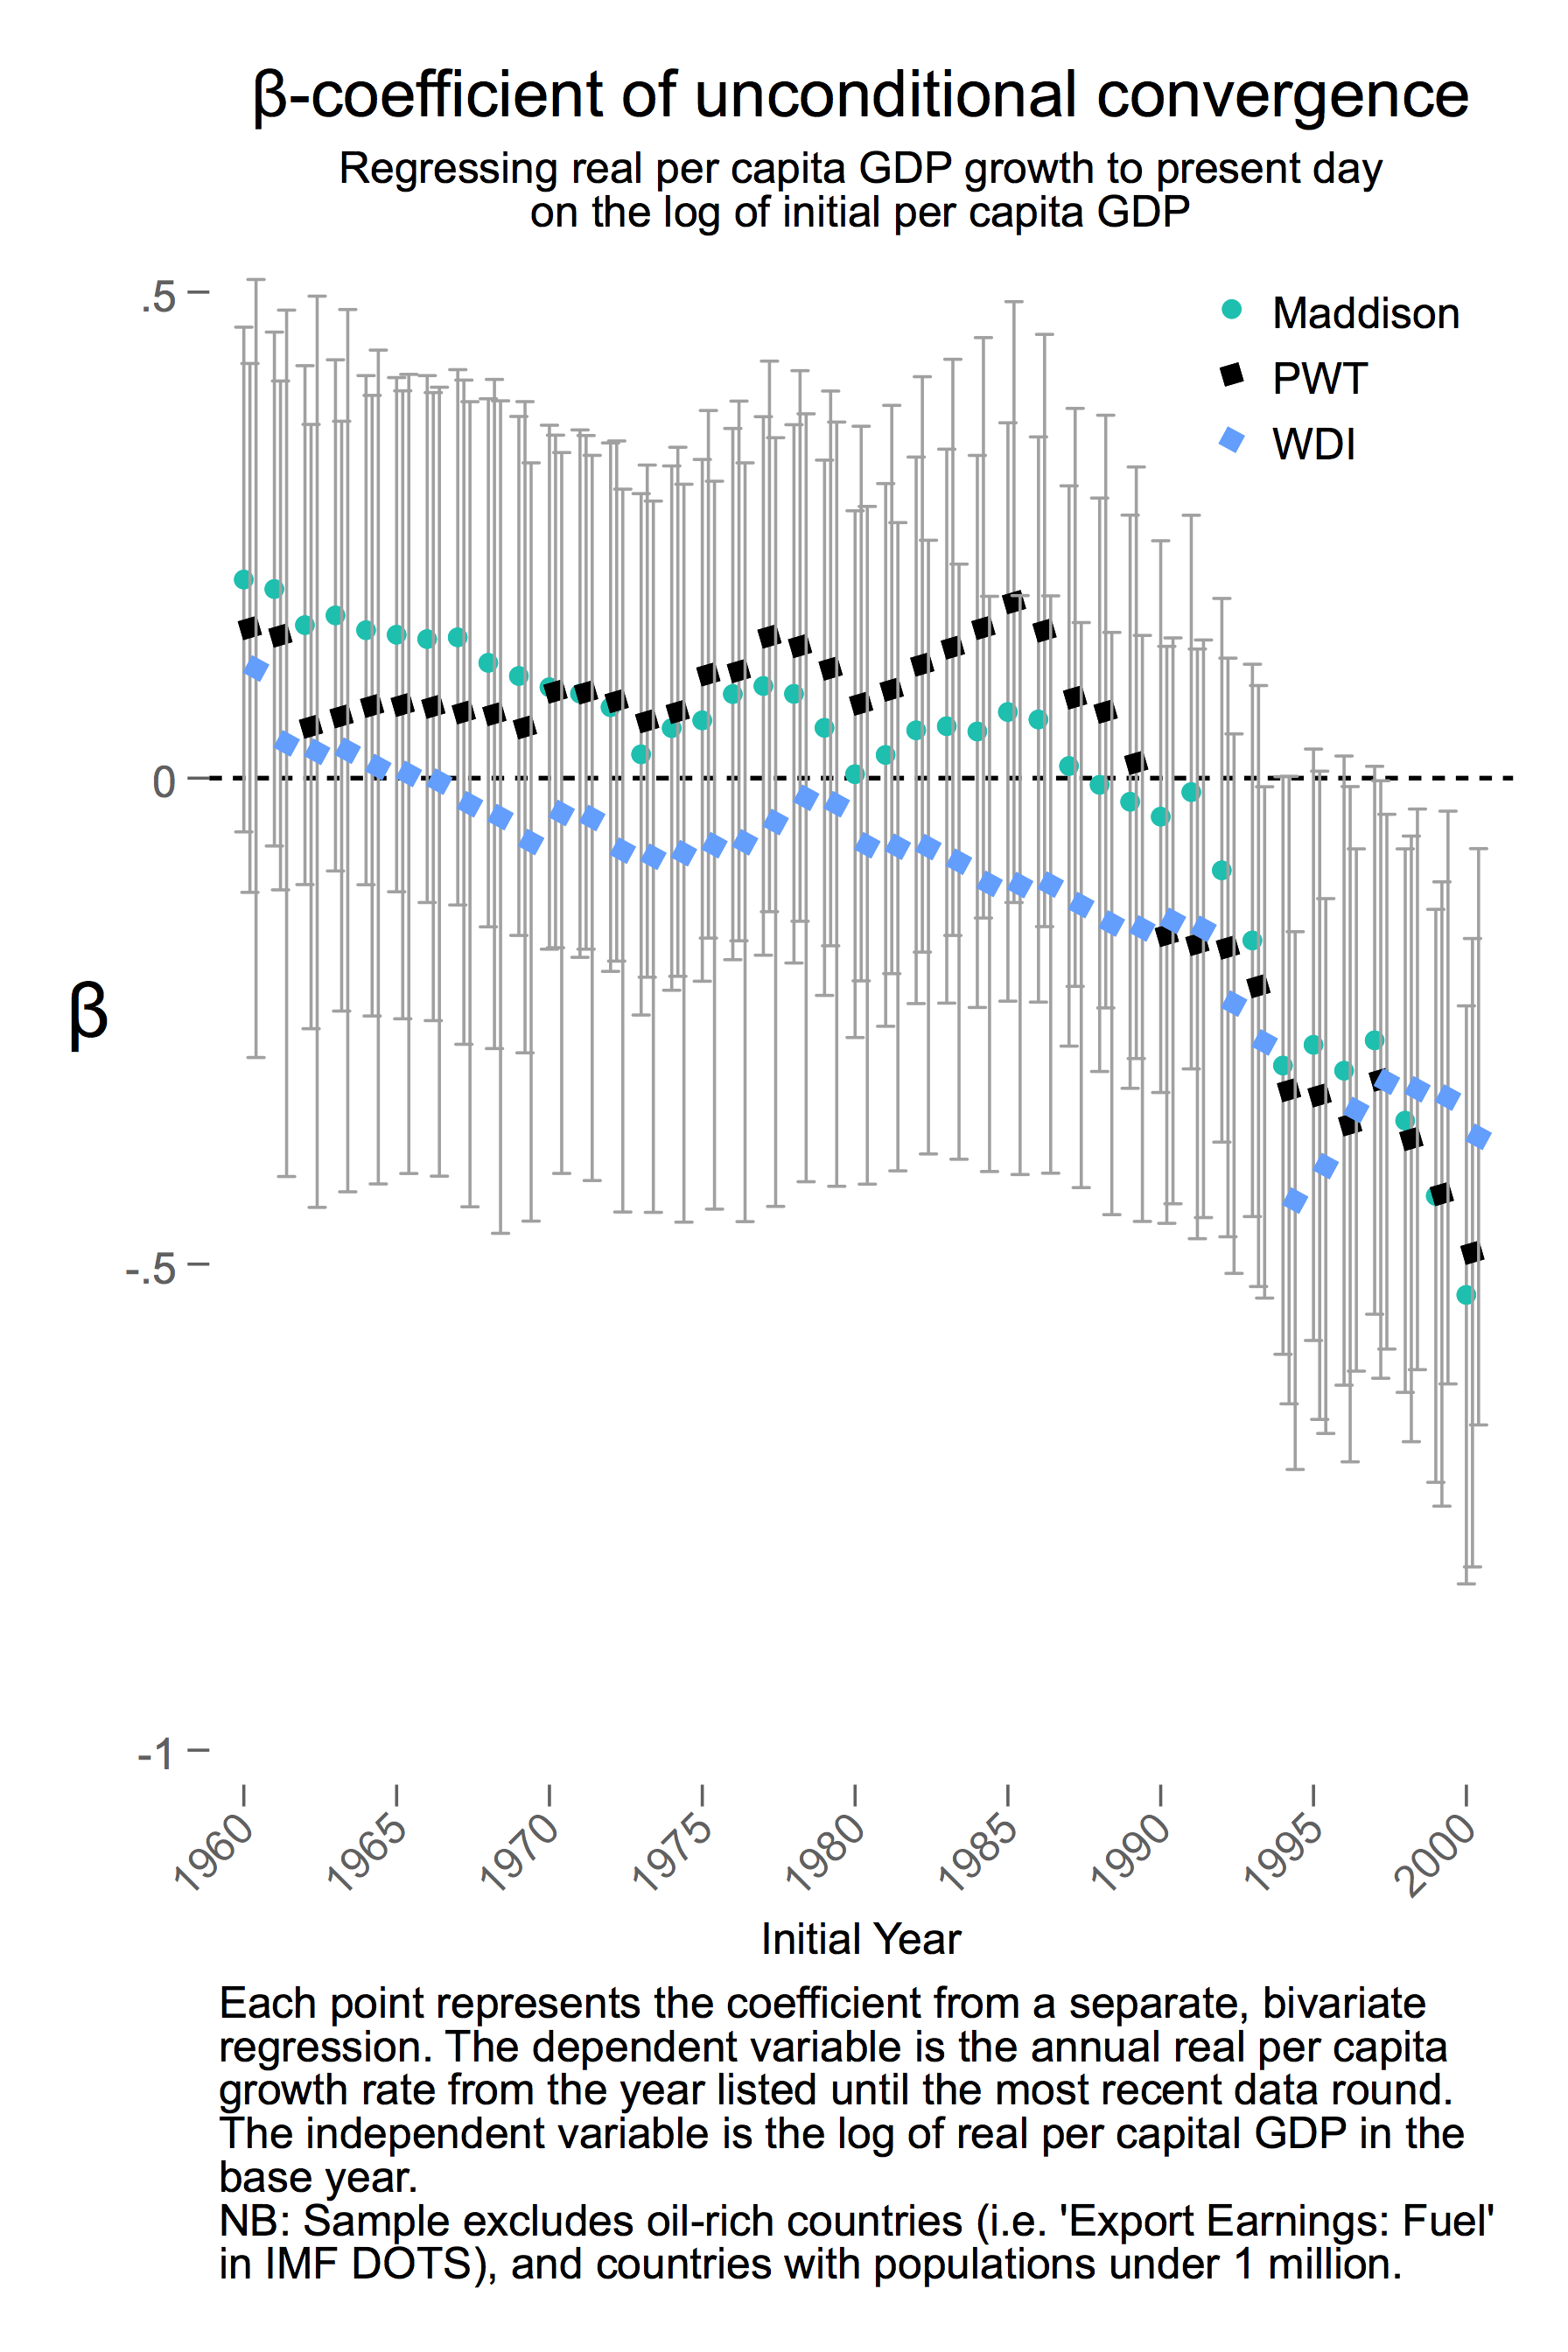
Each point in the graphic above represents the slope of a regression between the GDP in year X and the subsequent growth rate for each country. So a positive beta means that rich countries grew more quickly while a negative beta means that poor countries grew more quickly over the remaining time period. For the sake of clarity, the following graphic shows an example regression, where the slope of the line through each dataset is the beta value:
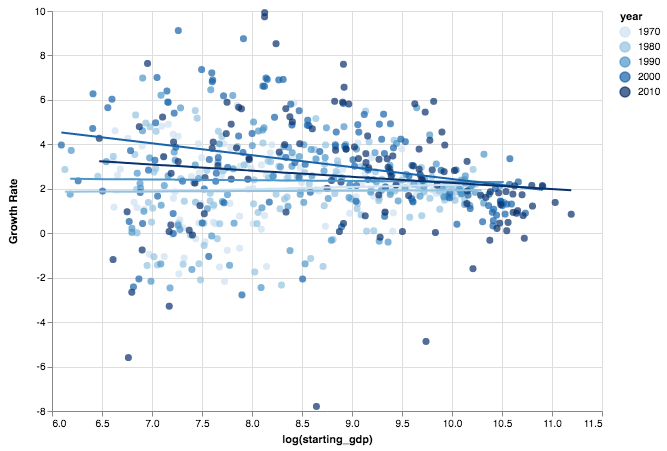
So the slope goes from being roughly flat in 1970 to negative in 2010. All the code and data for this post are available on GitHub here.
The Great Recession
One question I had when looking at the original graphic is how the great recession influenced these results. If the advanced economies were acting abnormally over the end period used for the calculations, it might lead us to the wrong conclusion about convergence. So I decided to re-create their code in Python and make the original beta plot:
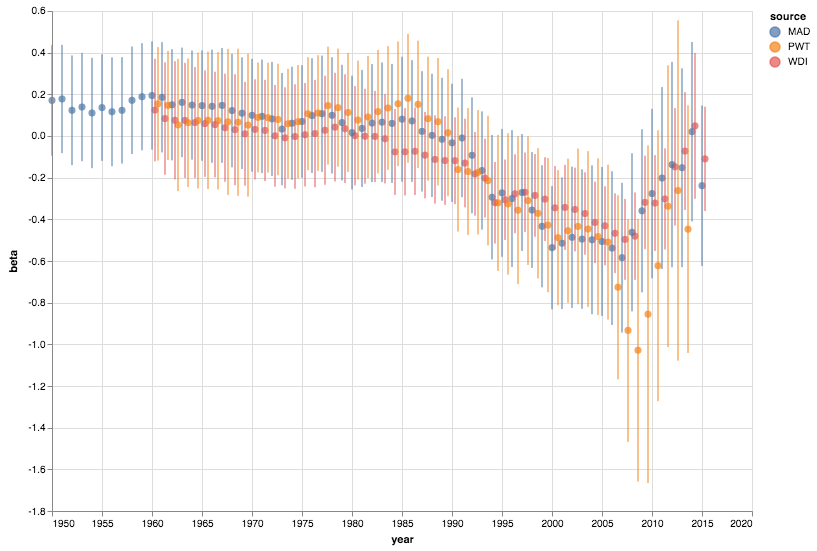
Note that this looks a little different because I extended the axis through 2020. I’m not sure why the authors ended the axis at 2000 in their version – perhaps the betas aren’t reliable beyond that point? Next, I created a plot that excludes the post 2006 data:
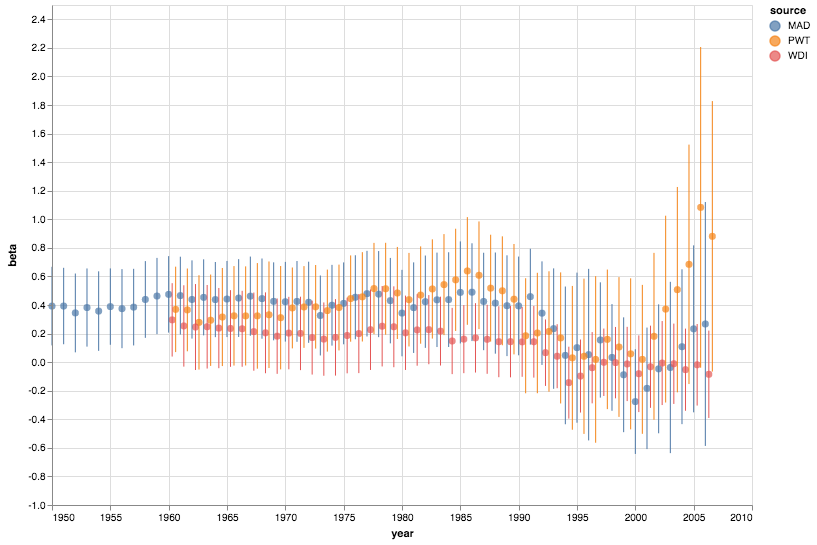
So a similar pattern is present, but the betas aren’t convincingly negative anymore. One might argue that excluding post 2006 data is unfair because it leaves out years of high growth for low and middle income countries. This is true, and I could try to construct a non-recession counterfactual for the rich countries to help deal with this but I won’t for now.
One could also argue that the recession and subsequent lower growth years were due to natural structural features of our economy so a policy response wouldn’t have helped. I disagree with this argument for a few reasons discussed more here and here. Mainly, I find it implausible that structural factors would manifest themselves immediately during a financial crisis rather than steadily over time. For example, here are the projected vs. actual GDP numbers for the US and Eurozone for the past few years:
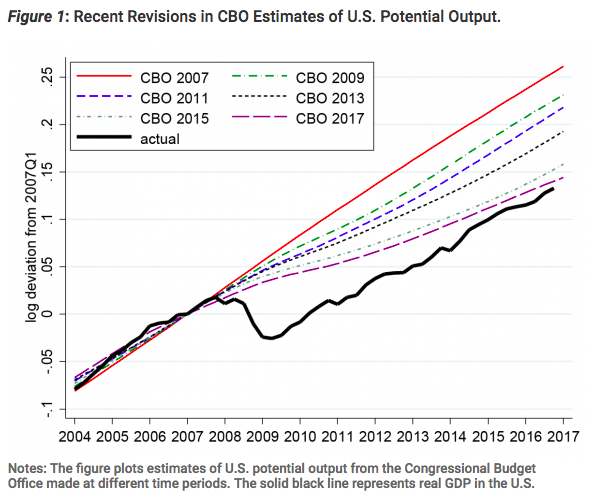
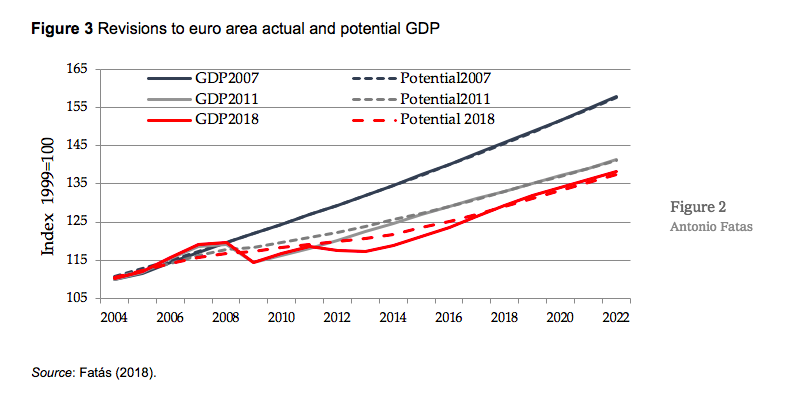
So the financial crisis seems to have had an immediate and lasting effect, and we keep underperforming the projections even after the effects of the recession have been taken into account. Many economists seem to think that the post financial crisis stimulus was net beneficial, and more could have been done by spending on things like infrastructure, which needs to be done eventually anyways. So the GDP performance and beta plots above could look significantly different if we had a better policy response to the crisis.
But if we start excluding data on the basis of policy incompetence, there’s plenty of that to go around, so we might be left without any data to study in the end. So I guess even bad policy responses need to be considered part of the economy eventually. Maybe western countries just aren’t able to enact reforms in some situations because of the political consequences, so the poor performance above should be considered the new normal for the time being.
Recession or Acceleration?
So looking at the full dataset, negative beta values could be caused by a few things:
- Slower growth in rich countries.
- Higher growth in poor countries.
- A combination of both.
So what’s the main driver? Below, I bin the earlier scatterplot by initial GDP to show that #3 (a combination of both) seems to be the answer, although the main driver seems to be higher growth in low and middle income countries.
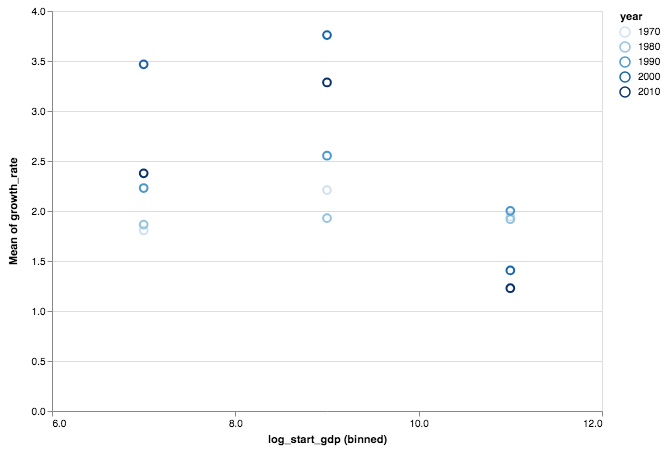
I actually think this plot is more informative than the beta plot above because I’m more interested in absolute rather than relative levels of growth. This is because the largest marginal improvements to health and wellbeing probably come at early stages of growth due to improvements in things like infrastructure and public health systems, regardless of the GDP relative to other countries. So it’s great that low and middle income countries are growing more quickly!
The Road Ahead
Finally, I thought it would be interesting to include a plot of per capita GDP over time for a few key countries:
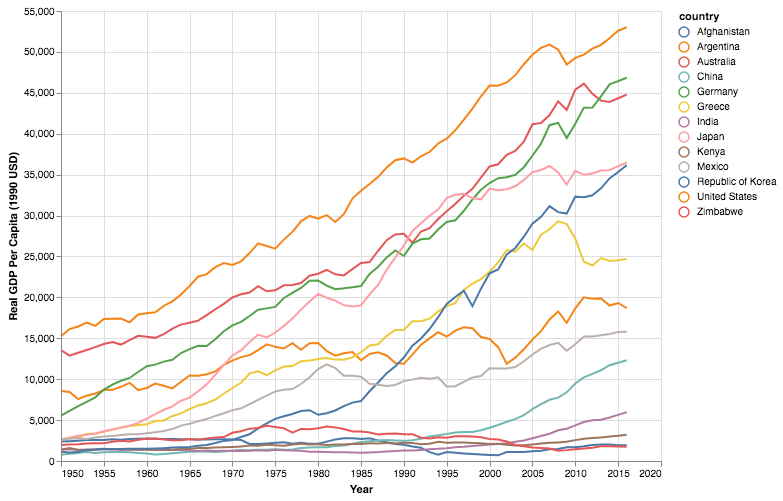
This plot highlights the differences between economies and the large gap lower income countries need to make up. Dietrich Vollrath made this point in a post where he estimated it could take close to 190 years for economies to converge at the beta rates estimated above. That’s a long time to sustain the current levels of growth.
There are reasons to be concerned that a few economies, especially in Sub-Saharan Africa, will have a tough time maintaining that growth. Dani Rodrik and others have made this point in their work on premature deindustrialization, which suggests a traditional development model via structural transformation might not be possible anymore. So these countries probably need to invent new ways of growing their economies that aren’t so dependent on manufacturing, or actively promote certain upstream industries through policy. But even with the challenges ahead, the recent growth in lower income countries is encouraging.
References
[1] Convergence (economics). Wikipedia. https://en.wikipedia.org/wiki/Convergence_(economics)
[2] Solow-Swan Model. Wikipedia. https://en.wikipedia.org/wiki/Solow%E2%80%93Swan_model
[3] Everything You Know about Cross-Country Convergence Is (Now) Wrong. Dev Patel, Justin Sandefur and Arvind Subramanian. https://www.cgdev.org/blog/everything-you-know-about-cross-country-convergence-now-wrong
[4] The Economic Future Isn’t What It Used to Be. Paul Krugman. https://www.nytimes.com/2018/09/30/opinion/the-economic-future-isnt-what-it-used-to-be-wonkish.html
[5] Real-Time Estimates of Potential GDP: Should the Fed Really Be Hitting the Brakes? https://www.cbpp.org/research/full-employment/real-time-estimates-of-potential-gdp-should-the-fed-really-be-hitting-the
[6] Self-fulfilling pessimism: The fiscal policy doom loop. Antonio Fatás. https://voxeu.org/article/europes-fiscal-policy-doom-loop
[7] Economic Stimulus Revisited. IGM Economic Experts Panel. http://www.igmchicago.org/surveys/economic-stimulus-revisited
[8] Infrastructure. IGM Economic Experts Panel. http://www.igmchicago.org/surveys/infrastructure
[9] Building the case for greater infrastructure investment. Larry Summers. http://larrysummers.com/2016/09/12/building-the-case-for-greater-infrastructure-investment/
[10] New evidence on convergence. Dietrich Vollrath. https://growthecon.com/blog/Convergence/
[11] Premature deindustrialization in the developing world. Dani Rodrik. https://rodrik.typepad.com/dani_rodriks_weblog/2015/02/premature-deindustrialization-in-the-developing-world.html
[12] Are emerging economies deindustrializing too quickly? https://ourworldindata.org/growth-and-structural-transformation-are-emerging-economies-industrializing-too-quickly
[13] Premature Deindustrialization. Tyler Cowen. https://www.youtube.com/watch?v=xsAjHzAGZDU
[14] Industrial policies and production networks. Ernest Liu. https://jrc.princeton.edu/news/industrial-policies-and-production-networks