Visualizations

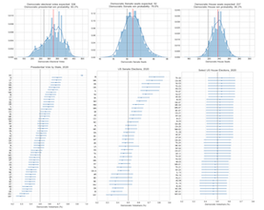
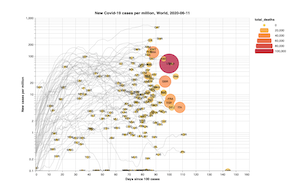
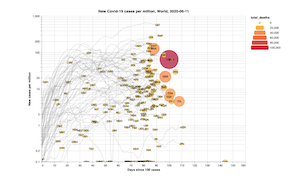
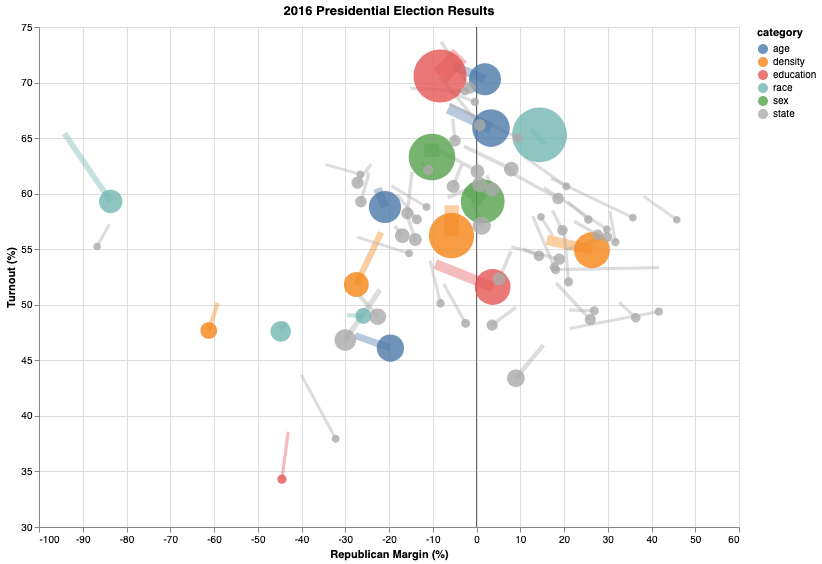
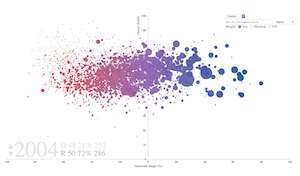
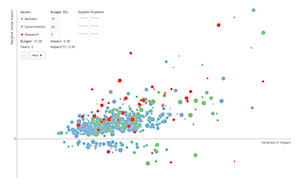
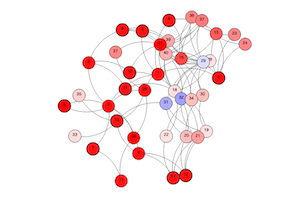
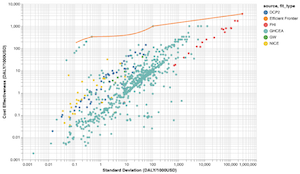
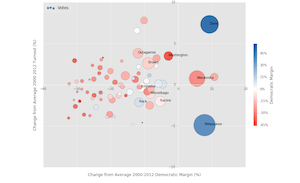
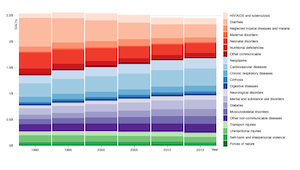
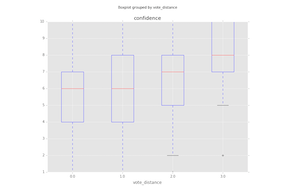
Here’s a collection of some of the visualizations I’ve made. For static ones, matplotlib generally works well for me. If I need an interactive visualization, I’ll generally use Altair for simple situations and D3.js when more complex behavior is needed.

Elections Meta
(demo, source)
Covid-19 Probability
(demo, source)
Covid-19 Timeseries
(demo, source)
OneVis
(demo, source)
National Election
(demo, source)
Mental Model
(demo, source)
Network Model
(demo, source)
Social Returns to Risk
(demo, source)
Global Obesity
(demo, source)
Economic Convergence
(demo, source)
Voting Power
(demo, source)
Climate Change
(demo, source)
Wisconsin Election
(demo, source)
Global Burden of Disease
(demo, source)
IGM Forum
(demo, source)