I think most people have some type of explicit or implicit mental model of how the world works. I decided to try to create a visualization of mine, which I included below. Although it’s not meant to be comprehensive or mathematically perfect, I think it captures what I see as the important features and interactions between different sectors of society. The goal is to improve this over time so hopefully this visualization opens my ideas up for critique or contributions.
There are three sectors in this model: markets, governments, and research. Each circle is a project that needs funding, which could represent an existing product or service in the market, a program like Medicaid within the government, or the ongoing work of a university lab in the research sector. The radius of each circle is proportional to the room for more funding – when the project has been fully funded the radius and marginal impact of additional funding drop to zero. The x-axis represents the variation in project outcome and the y-axis represents the marginal social impact of the project using units of something like wellbeing per dollar spent.
The user can set the percentage of the budget devoted to each sector and the allocation of each sector’s money between exploitation (funding existing projects), and exploration (searching for new projects). Any money allocated to the explore budget is spent on generating new circles, drawn from lognormal distributions. The respective exploit budgets are spent on the projects when the user clicks the “Next” button, resulting in wellbeing that is added into the Impact and Impact/Year categories. The end goal is to get a high Impact/Year score.
Here are a few things I hope this visualization demonstrates:
Diminishing Returns
The marginal impact of each project declines linearly as it’s room for funding is used up. This is a pretty fundamental concept in economics and I think it applies to most situations in the real world. One aspect of the model that avoids diminishing returns is the exploration phase, as the probability of generating a bubble in each location remains constant over time for each sector. This fits well with my intuition about the world – there are diminishing returns to exploiting existing knowledge but not to generating new knowledge.
The Importance of Economic Growth
I think the income approach to measuring GDP is most helpful for thinking about economic growth in this model. A certain amount of income is generated in each time step, most of which goes to corporations and individuals. We as a society then decide what to do with this money in the next time step. We can leave it with individuals and corporations which ends up largely being invested in markets, or we can tax it and put it into government services or basic research.
All money left in markets grows at three percent each year to match historical real GDP growth. This is a simplification for a few reasons. First, government and research spending are also part of the GDP. Second, government spending can have a multiplier effect especially during recessions. Third, technological progress is thought to be one of the main drivers of long-run growth in at least the Solow model. But I needed to demonstrate that there would be a penalty over time if the user taxed their whole economy to put the money into research, so this is my solution.
One of the best approaches to getting a high Impact/Year over the long term is to put 80-90% of the budget in the Market and let it grow. I suspect the percent of money allocated to markets and the long term growth rate of three percent would be the most important parameters if I ported this over to Python and ran some simulations. This model behavior fits well with the real world data. For example, GDP per capita correlates strongly with life satisfaction over time and across countries.
Social Impact is the Goal
I use social impact as the measure of progress rather than GDP. I think the distinction between the two is important because if we used GDP, the immediate impacts of government or research would drop substantially (even if they have large indirect effects). It’s only through the lens of wellbeing that many of the actions of government or research make sense.
The Roles of Different Sectors
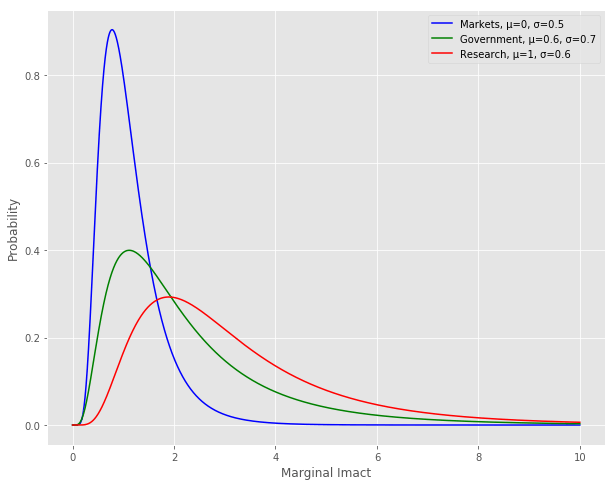
The main point here is that markets, governments, and research all draw from different probability distributions. Markets largely work at lower levels of risk, and, although the projects here have lower marginal impacts, the number of opportunities here outnumber those in other sectors. I estimate lower marginal impacts here because the alternative for a consumer in a competitive marketplace is usually a similar product with a slightly higher price if a company doesn’t offer a product. The rarer case where a single company makes a decision that has a large social impact (because it’s truly innovative or has monopoly power) is located in the tail of the distribution.
Research, on the other hand, is able to accept higher variability for higher social returns. Researchers are often criticized by the public for working on esoteric projects without clear applications, but occasionally something like CRISPR-Cas9 is discovered that has a revolutionary effect. Both the exploration and exploitation phases of research need to be funded for research to work well – if no exploitation is funded the highest impact findings never translate into markets. But if you don’t do enough exploration the pipeline of new ideas dries up, which prevents you from taking advantage of the full potential of research.
The bulk of Government projects exist in a middle ground between markets and research. This is because governments are often directly addressing problems in areas of market failures like the insurance market for low income individuals. The marginal impact is fairly large in a situation like this because the counterfactual for an individual with no insurance is probably a delay in treatment until an emergency room visit.
Occasionally governments need to make a decisions during crises where catastrophic outcomes are possible. To get a feel for this, consider simulating one of our many nuclear close calls [3, 4] over and over again with small changes in the initial conditions. Realistic outcomes for this experiment would probably range from completely avoiding conflict to the destruction of our civilization. Government impact in situations like these is mainly driven by path dependence – the actions can’t be undone or modified.
Research, on the other hand, largely functions by shifting the future into the present more rapidly, so the main benefit is applied during the time before the discovery would have occurred otherwise [5]. (Note: this isn’t always the case because research can have a time dependent application. For example, advances in battery technology for storing renewable energy might prevent a path dependent change in our climate right now.)
The Explore-Exploit Tradeoff
This tradeoff is common in optimization problems across many different domains [6, 7, 8, 9] . Every society needs to find an equilibrium between present and future benefits, so I thought this would be an important concept to build into the model.
Possible Negative Effects
Not every exploration results in a project with an positive expected marginal impact. For a random 10% of the projects I multiply the impact by -0.5, resulting in a bimodal distribution. Nevertheless, the project is funded at the same level as other projects because society isn’t always very good at discerning impact. In this model, larger potential negative effects come with higher levels of risk. For example, some areas of research or government actions have the potential to be catastrophic if we’re not careful. These catastrophic risks would dwarf the rest of these projects in negative or positive impact, which is part of the reason I don’t include numerical axes as it’s difficult to legibly show the impacts on the same scale.
The Role of Philanthropy
Philanthropists could act in this model in a few ways. First, they could try to choose a existing project with a high marginal impact and fund it until it’s marginal impact is lower than a different project, then switch to a new one. Second, they could fund the exploration phase of research to try to create an opportunity that is better than the existing options. Finally, they could try to change the model parameters by influencing the political process or funding research about the optimal model settings.
Philanthropists tend to take many different approaches in society, but I think taking big risks to create new ideas or trying to influence policy for the better are among the best opportunities [10, 11, 12].
Model Problems
There are a number of problems with this model. In addition to the ones I mentioned above, here are a few more:
- Causation isn’t so clear cut. For example, good economic policy might lead to better functioning markets, which might free up more money for research, which might result in research that improves economic policy. This seems to operate more like a mutually beneficial relationship where you can’t neatly divide things up by causation.
- Growth isn’t fixed. I set the growth rate at three percent in this model, but in reality there would be a feedback between the settings and growth. I might create a future version where the user can change the rate and observe the effect, but adding a feedback would get very complicated.
- Can wellbeing be summed? There are a few philosophical objections to summing wellbeing. Also, some make the point that measuring total wellbeing doesn’t account for the distribution of that wellbeing, which is a valid point.
- Can money buy everything? In the case of a well functioning government, funding might not be the limiting factor on competence. No amount of project funding will suddenly improve decision making skills in a crisis. Government competence is something that needs to be built over decades and centuries, and probably depends on something other than funding levels.
- Different distributions? It’s possible that the lognormal distribution isn’t the best fit for opportunities to do good in the world. Maybe a power-law distribution would fit better, or maybe I need to change the existing lognormal parameters. Right now they’re tuned for visual communication, not accuracy.
Conclusion
It took me a while to understand this, but the above concepts imply that both of these can simultaneously be true:
- The vast majority of good that is done in the world is achieved through markets.
- The best opportunities to do good in the world lie outside of markets.
This is because the opportunities with the highest marginal impacts lie in the tails of the government and research distributions. I hope you find this model interesting. It’s a first draft, so feel free to critique or contribute. In the future I might create a version that allows people to choose the probability distributions parameters to fit with their intuitions about the world, so stay tuned.
Appendix A: How It Works
There can be large differences in the impacts of different actions so I generate the data using a joint lognormal probability distribution with a correlation between the risk and impact. The specifics of how the joint distributions are generated are in a separate blogpost if you’re interested. I leave numbers and units off the axes because I don’t think there’s a single measure of wellbeing and the relationship between the sectors matters more than the numerical values.
The user can set the percentage of the budget devoted to each sector and the allocation of each sector’s money between exploitation (funding existing projects), and exploration (searching for new projects). When the user clicks the “Next” button, the exploit budget is allocated to each circle by finding the maximum percentage that can be multiplied times the project funding needs in each sector while staying below the budget. This means that society funds every project by some amount because it doesn’t always know the real marginal impact of each project.
Here’s the section of the code that finds the percentage funding level:
var sum = 0.0,
    pct = 0.0;

while (sum <= exploit_budget) {
    sum = 0.0;
    pct += 0.001;
    for (var j = 0; j < sector.length; j++) {
    	sum += pct * sector[j].size;
    }
}
As the research projects are funded, the variation associated with each project declines and the bubbles diffuse through the market. Once a research project has a low enough variation, there’s a ten percent chance that it will transition to the market’s budget each year. This aspect of the model isn’t perfect, as the transition to markets should be governed by risk with respect to market returns, not risk with respect to social impact. But if the two are at least correlated I think it’s an okay assumption.
For exploratory funding, new circles are generated from lognormal distributions with unique mus and sigmas for each of the sectors. This model is somewhat informed by the concept of an efficient frontier from modern portfolio theory. Generally, I think there’s a positive relationship between risk taking and societal impact, although greater potential for societal harm comes at high levels of risk as well.
Because markets are driven by a profit motive and have a shorter time horizon, their risk profile and corresponding social impact are lower (smaller mus and sigmas). Governments and basic research can play at higher levels of risk, so they’re rewarded accordingly with higher marginal social impacts (higher mus and sigmas). Research has more projects in areas of moderately high social impact than government (higher mu), but government has a heavier tail at the very high levels of impact (higher sigma). The heavier tail for Government is driven by situations like nuclear crises where decisions have the potential to dwarf all the other areas in impact.
Finally, three percent of the money allocated to markets is added to the budget each year. This is meant to simulate the importance of economic growth, and penalizes putting too much money into research or government. The growth rate and money allocated to markets are some of the most important factors in the long term performance of the model.
Generating samples from joint lognormal distributions ended up being much more difficult than I thought it would be. There are a number of resources out there and packages for languages like Python and R, but nothing for JavaScript. See this blogpost for more on how I did this with JavaScript.
References
[1] What’s So Special About Science (And How Much Should We Spend on It?). Science. http://science.sciencemag.org/content/342/6160/817
[2] Happiness and Life Satisfaction. Our World in Data. https://ourworldindata.org/happiness-and-life-satisfaction/#correlates-determinants-and-consequences
[3] List of nuclear close calls. Wikipedia. https://en.wikipedia.org/wiki/List_of_nuclear_close_calls#1950s
[4] Close Calls with Nuclear Weapons. Union of Concerned Scientists. http://www.ucsusa.org/sites/default/files/attach/2015/04/Close%20Calls%20with%20Nuclear%20Weapons.pdf
[5] Estimating the cost-effectiveness of research into neglected diseases. Future of Humanity Institute. http://www.fhi.ox.ac.uk/research-into-neglected-diseases/
[6] Exploration versus exploitation in space, mind, and society. Trends in Cognitive Science. https://www.ncbi.nlm.nih.gov/pmc/articles/PMC4410143/
[7] The Network Structure of Exploration and Exploitation. Administrative Science Quarterly. http://lazerlab.net/publication/network-structure-exploration-and-exploitation
[8] Multi-armed bandit. Wikipedia. https://en.wikipedia.org/wiki/Multi-armed_bandit
[9] Searching for the Devil in the Details: Learning about Development Program Design. Center for Global Development. https://www.cgdev.org/publication/searching-devil-details-learning-about-development-program-design-working-paper-434
[10] What Are Foundations For? Boston Review. http://bostonreview.net/forum/foundations-philanthropy-democracy
[11] Hits-based Giving. Open Philanthropy Project. http://www.openphilanthropy.org/blog/hits-based-giving
[12] The Elusive Craft of Evaluating Advocacy. Stanford Social Innovation Review. https://ssir.org/articles/entry/the_elusive_craft_of_evaluating_advocacy
[13] Capability Traps? The Mechanisms of Persistent Implementation Failure. Center for Global Development. https://www.cgdev.org/publication/capability-traps-mechanisms-persistent-implementation-failure-working-paper-234