If you’re trying to improve the world, should you avoid uncertainty or embrace it? Is it better to spend money on a temporary health intervention or fund research to eventually find a cure? I tried to answer these questions in a previous post by looking at standalone data from a variety of sources. Some of the sources shared similar enough units that they could be combined, so I try to do so below.

All the code and data for this project are available on GitHub here.
Data Wrangling
Because both the GiveWell and Future of Humanity Institute (FHI) data share the same units, I can combine them to get a sense of the scale. Also, if I lazily assume that I can estimate the standard deviation of the Disease Control Priorities (DCP2) and National Institute for Health and Care Excellence (NICE) estimates by dividing the range of the estimates by two, those can be included as well. Note also that the NICE estimates are median results while Givewell and FHI are mean results, so this might need to be changed. There are more in-depth descriptions of the sources for these data in my previous post.
All the other conversions are pretty straightforward, but the Global Health Cost Effectiveness Analysis Registry (GHCEA) data required more wrangling. I back-calculated the standard deviations from the confidence interval widths using the figures defined on Wolfram here, assuming the confidence intervals follow a normal distribution. In addition to the calculations above, I filter out any GHCEA studies that were rated below 4.5 by reviewers on a 1-7 quality scale. The end result is 653 interventions with standard deviations and cost effectiveness estimates.
One final thing to consider: the Givewell numbers are estimates of the marginal impact of donating to existing charities, while many of the other sources measure impact against a counterfactual using an Incremental Cost Effectiveness Ratio without a clear avenue for donors to make that change happen. Instead, many of these interventions probably need to be implemented at the hospital, insurer, or government policy level rather than through a charity (although a charity could lobby for these changes). So the GiveWell numbers might be more rigorous because they’re estimates of the current scaled-up impact of an intervention, while some of the other estimates might be too optimistic because they come from experiments implemented under ideal circumstances at a certain point in time.
Putting It All Together
Below is a table of the combined 761 estimates and some histograms to get an idea of their distributions (mostly lognormal). Next, I fit some curves, run the portfolio optimization, and visualize the results.
| intervention | cost_effectiveness | stdev | source | |
|---|---|---|---|---|
| 0 | Research - Diarrhoeal diseases | 3549.783221 | 80857.231707 | FHI |
| 1 | Research - Meningititis | 1732.527683 | 41075.262076 | FHI |
| 2 | Research - Leishmaniasis | 1703.723172 | 8363.477589 | FHI |
| 3 | Routine measles-containing vaccine followed by... | 1000.000000 | 728.877849 | GHCEA |
| 4 | Aspirin alone (325 mg initial dose & subsequen... | 1000.000000 | 1645.853207 | GHCEA |
| 5 | Preventive treatment of malaria in pregnancy w... | 1000.000000 | 13.391457 | GHCEA |
| 6 | Preventive treatment of malaria in pregnancy w... | 1000.000000 | 334.566881 | GHCEA |
| 7 | New tuberculosis vaccine (40% efficacy) | 1000.000000 | 944.841656 | GHCEA |
| 8 | Research - Leprosy | 824.521890 | 71250.250787 | FHI |
| 9 | Research - Trypanosomiasis | 802.785665 | 110366.393439 | FHI |
| 10 | Research - Malaria | 801.655755 | 7066.975304 | FHI |
| 11 | Research - Multiple salmonella infections | 753.616047 | 16466.171159 | FHI |
| 12 | Research - Typhoid and paratyphoid fever | 709.092672 | 30713.464549 | FHI |
| 13 | Research - Chagas disease | 534.967344 | 6210.949437 | FHI |
| 14 | Syphilis screening before third trimester + tr... | 500.000000 | 303.979086 | GHCEA |
| 15 | Brief smoking cessation advice + Bupropion | 333.333333 | 0.058923 | GHCEA |
| 16 | Syphilis screening before third trimester + tr... | 333.333333 | 204.085798 | GHCEA |
| 17 | Intermittent preventive treatment in infants (... | 333.333333 | 255.746614 | GHCEA |
| 18 | Syphilis screening before third trimester + tr... | 333.333333 | 173.702335 | GHCEA |
| 19 | Intermittent preventive treatment in infants (... | 333.333333 | 330.235919 | GHCEA |
| 20 | Research - HIV | 303.678832 | 2132.474086 | FHI |
| 21 | Research - Trichuriasis | 251.336051 | 13978.148011 | FHI |
| 22 | New tuberculosis vaccine (40% efficacy) | 250.000000 | 132.695577 | GHCEA |
| 23 | Syphilis screening before third trimester + tr... | 250.000000 | 127.553624 | GHCEA |
| 24 | Syphilis screening before third trimester + tr... | 250.000000 | 151.989543 | GHCEA |
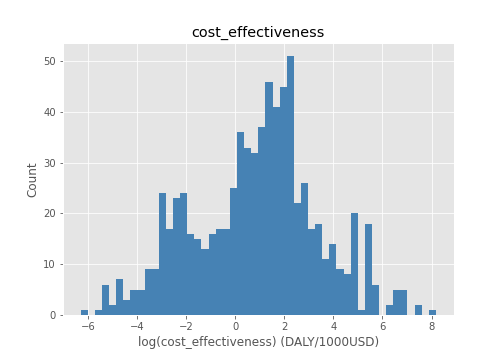
A histogram of all the results together:
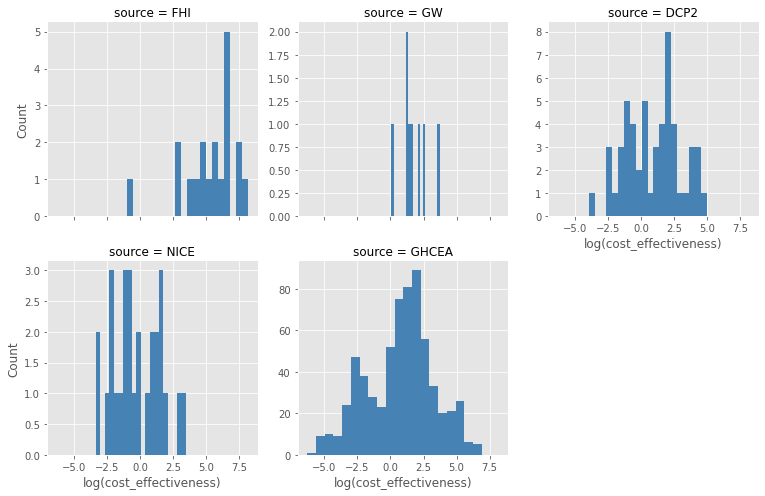
And here are histograms of the individual sources:
Fitting Some Curves
So how do I determine if there is a return to risk taking? One approach would be to run a linear regression through the data and see if it has a positive slope. This is what I do first below, but there’s a problem with this approach. To see why, imagine calculating the cost effectiveness of every possible action, including bogus things like lighting $1000 on fire. You’d end up with a lot of useless interventions that would mess up the slope of the linear regression.
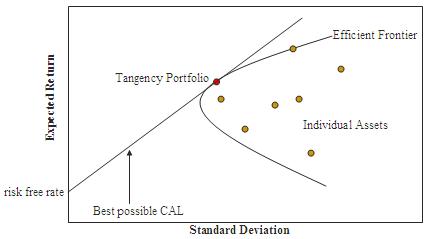
So my second approach is to just see if the frontier that encloses the top end of the estimates has a positive slope. In Modern Portfolio Theory, this frontier is called the efficient frontier, which I’ve written about before. I didn’t have enough data to test out this theory in the past, but the combination of all these sources makes it possible to do so now.
Below, I fit a linear regression and a power law to the results. The power law doesn’t have an r-squared value because this isn’t really a valid measure of goodness of fit for nonlinear curves. The first plot uses standard axes to get a sense of the scale:
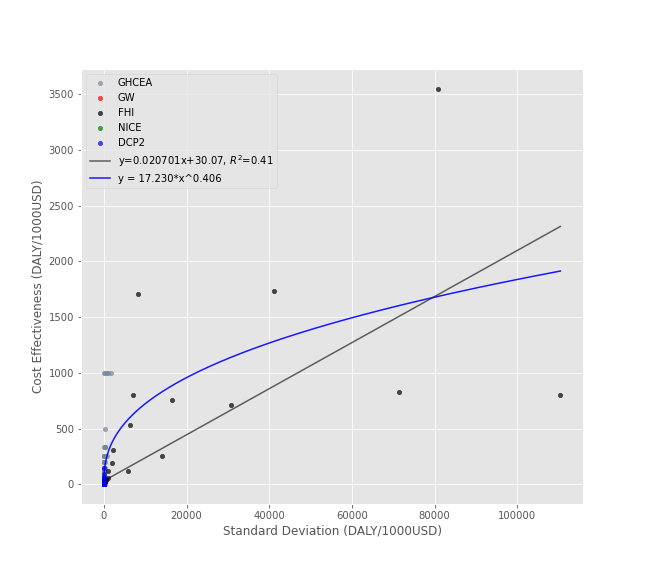
Here’s the same plot with log-log axes to get a better view the data:

The Efficient Frontier
Finally, I use a modified version of an algorithm described on Quantopian to generate an efficient frontier. Each point along the curve represents a portfolio of interventions with the highest expected impact for the level of risk. The covariance matrix I used as input is all zeros except for the variances, although this could be changed if you have some reason to think intervention outcomes are correlated in some way.
Note that the plot below is interactive with tooltips and scroll-to-zoom enabled.
Conclusion
- It seems like there are returns to risk taking for both the individual and combined estimates. This is useful to know because it means a a large error bound on a cost effectiveness estimate shouldn’t be disqualifying on it’s own.
- Plots like these could be useful for identifying promising interventions, especially when many independent estimates point in the same direction. This seems to be the case for many malaria, HIV, and smoking cessation interventions in the plot above.
- This framework could also provide a useful sanity check for future estimates. For example, if an estimate is far above the existing frontier, it might be worth reviewing it for an incorrect calculation or poor assumption. But it’s important to be careful when doing this because these estimates only cover a small fraction of the possible actions one could take in the world.
- The intervention with the highest expected impact (and highest uncertainty) is research into diarrheal disease. This suggests that research can be very beneficial even if it’s more uncertain. This relationship might be even more clear if we were to add estimates from more esoteric forms of basic research, although some forms of research might not be amenable to this type of analysis.
References
[1] Are there returns to risk taking in science, philanthropy, or public policy? https://pstblog.com/2017/12/02/risk-return
[2] Efficient Frontier. Wikipedia. https://en.wikipedia.org/wiki/Efficient_frontier
[3] psthomas: efficient-frontier. GitHub. https://github.com/psthomas/efficient-frontier
[4] Global Health Cost Effectiveness Analysis Registry. Tufts University. http://healtheconomics.tuftsmedicalcenter.org/ghcearegistry/
[5] Confidence Interval. Wolfram. https://mathworld.wolfram.com/ConfidenceInterval.html
[6] Relationship between the range and the standard deviation. Stack Exchange. https://stats.stackexchange.com/questions/69575/relationship-between-the-range-and-the-standard-deviation
[7] The Efficient Frontier: Markowitz portfolio optimization in Python. Quantopian.
https://blog.quantopian.com/markowitz-portfolio-optimization-2/
[8] Why Is There No R-Squared for Nonlinear Regression? http://blog.minitab.com/blog/adventures-in-statistics-2/why-is-there-no-r-squared-for-nonlinear-regression