This post is an introduction my new model of the 2020 elections, which is really a model of models. The general idea is to combine forecasts for elections at every level of government into an index, which can then be used to prioritize campaign efforts. I’ve made a few models in the past that tried to find the most influential elections. But the main problem with those approaches was that they were retrospective and didn’t consider tipping point thresholds in their calculations.
This new model fixes both these problems by pulling together current forecasts for the 2020 presidential, Senate, House, governor, and state legislative elections. I then calculate a realized power value for each seat by adjusting a potential power value for the probability of a close election and the tipping point probability for each of the seats. There are more details on how the model works in the appendix below, but first the results.
Election Forecasts
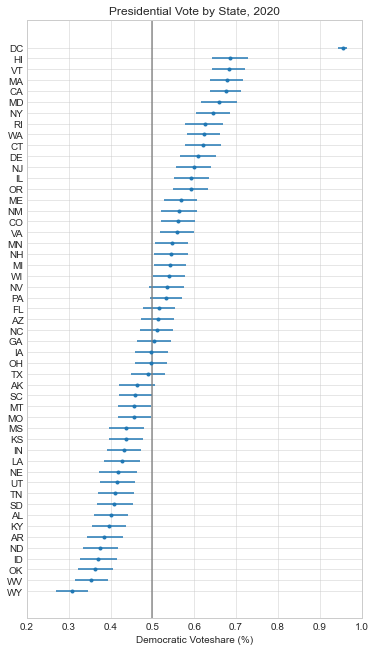
Here are the forecasts for the different offices and legislative bodies on the ballot in November. The presidential model is courtesy of The Economist, the Senate model is from Cory McCartan, the House and governor point estimates are from Inside Elections, and the state legislative point estimates are from CNalysis. The confidence intervals are 95%, except for the Senate which reports a 90% confidence interval.
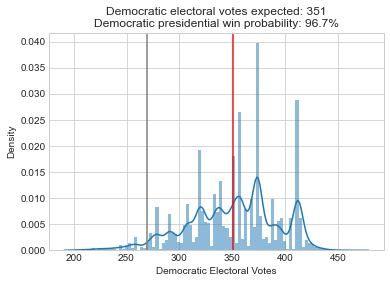
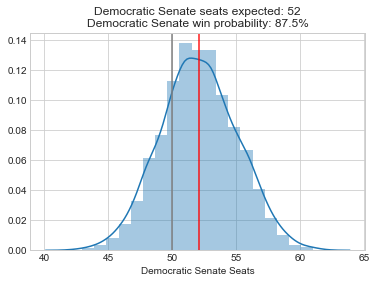
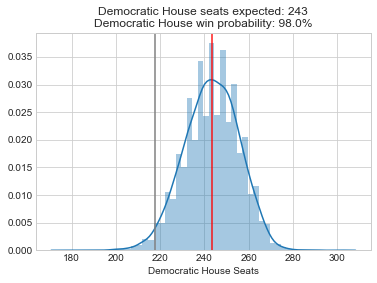
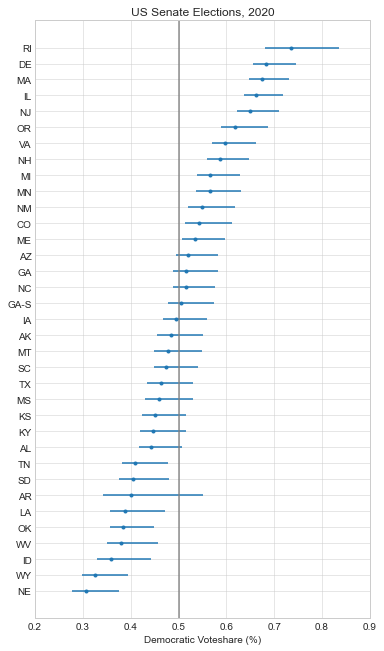
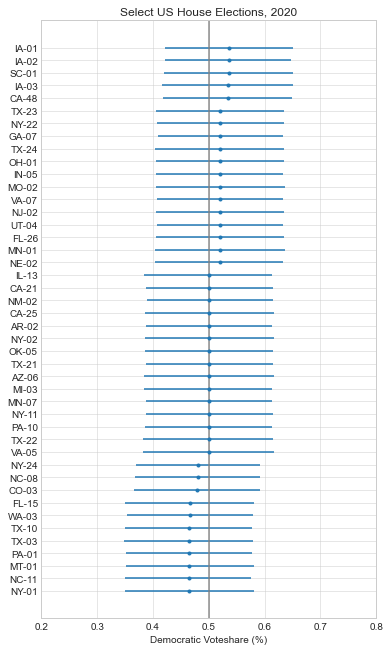
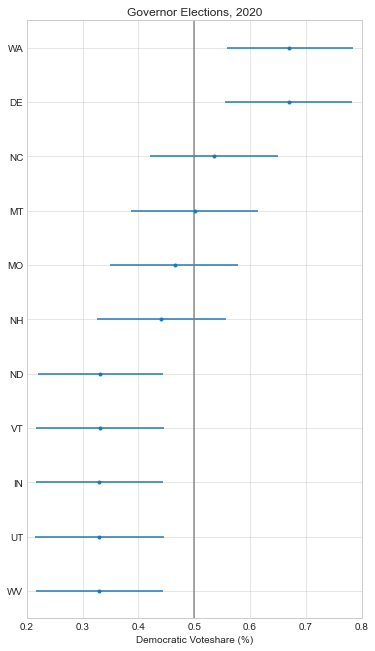
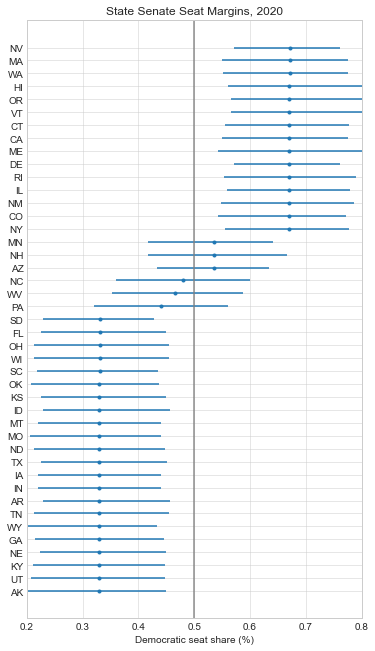
So overall things look pretty good for the Democrats right now, but the Senate is still expected to be close. One other thing to mention is that these aren’t nowcasts, they’re forecasts. Each one of these estimates takes into account how the race is expected to tighten from now until November, either through sophisticated modeling techniques in the case of the presidential and Senate models, or through expert judgement in the case of the categorical models. There’s an ongoing debate about how confident we should be in forecasts in general, but these models are at least trying to incorporate the best practices.
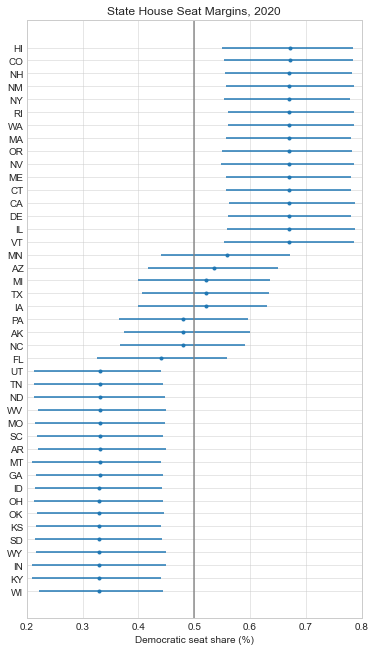
Power Values by State
It’s difficult to distill all of the election forecasts above into a set of priorities, but this is where my model comes in. I calculate a baseline power value for each office, then adjust it for how close the election is expected to be and how likely a seat is to be the tipping point for control if applicable. The general intuition here is that you should target elections that are likely to be close, and target legislative bodies where a change in partisan control is more likely.
So here are the resulting power values, grouped by state and office. Note that table is sortable, and you can adjust the weights if you prefer. By default I give equal weights to the state and federal governments. The results for each individual election sorted by realized power are available here).
Conclusion
So if you trust these models and weights, North Carolina seems like a good place to focus right now. It has close elections at every level of government and has a potential tipping point seat for the US Senate. Otherwise, if you think Trump represents a unique threat to our democracy and the risk adjusted harm of another term outweighs any other considerations, sort or reweight by the presidential column and focus on those states (currently PA, FL, MI, WI, MN, NC). Or maybe you think the president’s policy decisions have more tail risk in general, so this office should always have more weight. Whatever your preference, the goal of this model isn’t to give you an absolute answer, but instead give you results that can be adjusted based on your own assumptions.
I’ll try to keep these results up to date as new versions of the supporting models are released. All the code and data for this project are available on GitHub here.
Appendix: How it Works
To start off, I create a hierarchical power sharing model. I begin with an arbitrary 100 points of power, and allocate half to the federal government and half to the states. The power at the federal level is then further subdivided between the president (25) and Congress (25), with the House and Senate dividing the congressional power evenly. The other 50 points of power are divided between the states according to their fraction of the national population. Each state’s value is then split between the governor and state legislatures just like at the federal level.
total_power = 100

federal_power = 0.5*total_power
presidential_power = 0.5*federal_power
senate_power = 0.25*federal_power
house_power = 0.25*federal_power

states_power = 0.5*total_power
governor_power = 0.5*states_power
state_senate_power = 0.25*states_power
state_house_power = 0.25*states_power
Next, I need to adjust these potential power values for how close the elections are expected to be. My approach is somewhat inspired by Andrew Gelman’s paper (PDF) that calculates the probability of a single vote swinging the election. But instead of using the probability of a tie (which doesn’t make sense for an odd number of House seats or a governor’s race), I calculate the probability of a close election (pr_close). To do this, I fit a kernel density estimate to the simulated outputs for each model, and integrate 5% of the interval around the central outcome. So, in the case of the presidency, I fit a kernel density to the modeled electoral college outcomes, then integrate it from 255.55 to 282.45 electoral votes, which gives me a rough probability of the outcome falling within that interval. For the governors races, I just integrate the kernel density from 47.5% to 52.5% of the two party popular vote.
The next step is to calculate the tipping point probability by seat (pr_tip). For the governors races this is easy because winning the two party popular vote is the tipping point (pr_tip = 1). But in the case of the electoral college, some states are much more likely to put a candidate over the critical threshold of 269 electoral votes than others. So over the thousands of presidential simulations, I sort the states by vote margin for the winner of the electoral college, and then find the state that put the winner over the threshold. I use a similar approach to find the tipping point seats for the House, and the Senate model has these probabilities precalculated. At the state legislative level, I model two party seat share, so I don’t need to calculate a tipping point probability for these (it’s set to 1).
Note that I’m calculating the tipping point probabilities using all the simulations, not just the close ones. I’ve seen other approaches that only use close elections, but this produces results for me that are out of line with other estimates, so I’ll stick with using all the simulations for now. So now that I have all the values I need for every legislative body and seat, I can plug them into this equation to get my final adjusted values:
realized_power = potential_power * pr_close * pr_tipBecause these values are derived from the same initial power distribution and I use a uniform approach to adjusting them, they should be comparable across elections. Note that all the power values in the table above are just multiplied by 100 to make it easier to read.
Supporting Models
The Economist’s presidential model and Cory McCartan’s Senate model share their complete simulation results. So I just need to import those and do some processing to calculate the above values.
The House is a little more complicated because nobody is (was) doing a quantitative model for those elections by seat. So I take the categorical ratings for House seats from Inside Elections, convert the categorical ratings to numerical two party vote margins using 538’s quantifications, and then sample around these margins using normal distributions. This approach is inspired by Drew Linzer’s simple presidential model, where he models polling uncertainty using a normal distribution centered at the polling average with a standard deviation of 0.05, and estimates a national swing using a normal distribution with a standard deviation of 0.03. I’m a novice when it comes to modeling elections though, so feedback on this approach is welcome.
I model the governors races using a similar approach to the House above, I take the ratings from Inside Elections, quantify them, and then sample around them with normal distributions. For state legislatures, it’s a little bit beyond me to model each individual seat. So instead I model the expected Democratic seats for each body. I take the state legislative ratings from CNalysis, quantify them, convert the percentage margin to a seat count, then sample around the expected seat count using the same uncertainty as above, just scaled to the number of seats in each state legislative body. I then integrate all of these simulated distributions over the same 5% interval to calculate pr_close as mentioned above.
References
[1] What is the probability your vote will make a difference? Andrew Gelman, Nate Silver. http://www.stat.columbia.edu/~gelman/research/published/probdecisive2.pdf
[2] Simple presidential model. Drew Linzer. https://twitter.com/DrewLinzer/status/1293216060456329216
[3] How FiveThirtyEight’s House Model Works, 2018. https://fivethirtyeight.com/features/2018-house-forecast-methodology/
[4] Forecasting the US elections, President. The Economist. https://projects.economist.com/us-2020-forecast/president
[5] 2020 Senate Forecast. Cory McCartan. https://corymccartan.github.io/projects/senate-20/
[6] Inside Elections House Ratings. Nathan Gonzales. http://insideelections.com/ratings/house
[7] Inside Elections Governor Ratings. Nathan Gonzales http://insideelections.com/ratings/governor
[8] CNalysis State Legislature Ratings. Chaz Nuttycombe. https://www.cnalysiscom.website/
[9] Post Code and Data: psthomas/elections-meta. https://github.com/psthomas/elections-meta